Overview & Problem Statement
India's fiscal federalism relies on a complex system of tax devolution where the central government shares a portion of its tax revenues with state governments. The Finance Commission, constituted every five years, determines the share and criteria for this distribution.
This project analyzes the devolution of Rs.111 lakh crore in central taxes across 28 states over five fiscal years (2020-21 to 2024-25). The analysis examines whether the current formula adequately addresses regional disparities, promotes equitable development, and aligns with the constitutional mandate of cooperative federalism.
Key questions explored include: How do Finance Commission recommendations translate into actual allocations? What patterns emerge in state-wise distributions? How does revenue capacity correlate with fiscal needs? And what are the implications for states with varying levels of economic development?
Methodology
The analysis follows a structured approach combining data collection from government sources with interactive visualization techniques to make fiscal data accessible.
Data Collection
Gathered tax devolution data from Union Budget documents, Finance Commission reports (14th and 15th), and RBI state finance publications for FY 2020-21 through 2024-25.
Data Processing
Cleaned and structured raw fiscal data, normalized figures for inflation adjustment, and computed per-capita devolution metrics using Census 2011 population estimates.
Criteria Analysis
Decomposed the Finance Commission's multi-criteria formula including income distance, population, area, forest cover, and demographic performance into weighted components.
Visualization
Built interactive Chart.js visualizations including choropleth maps, bar comparisons, trend lines, and Sankey diagrams to present allocation flows.
Key Findings
- Uttar Pradesh receives the largest absolute share of devolution (~17.9%), driven primarily by its population weight, while smaller states like Goa and Sikkim receive the least in absolute terms but rank highest in per-capita allocation.
- The income distance criterion, which allocates more to states with lower per-capita income, results in states like Bihar and Jharkhand receiving disproportionately higher shares relative to their population, reflecting the redistributive intent of the formula.
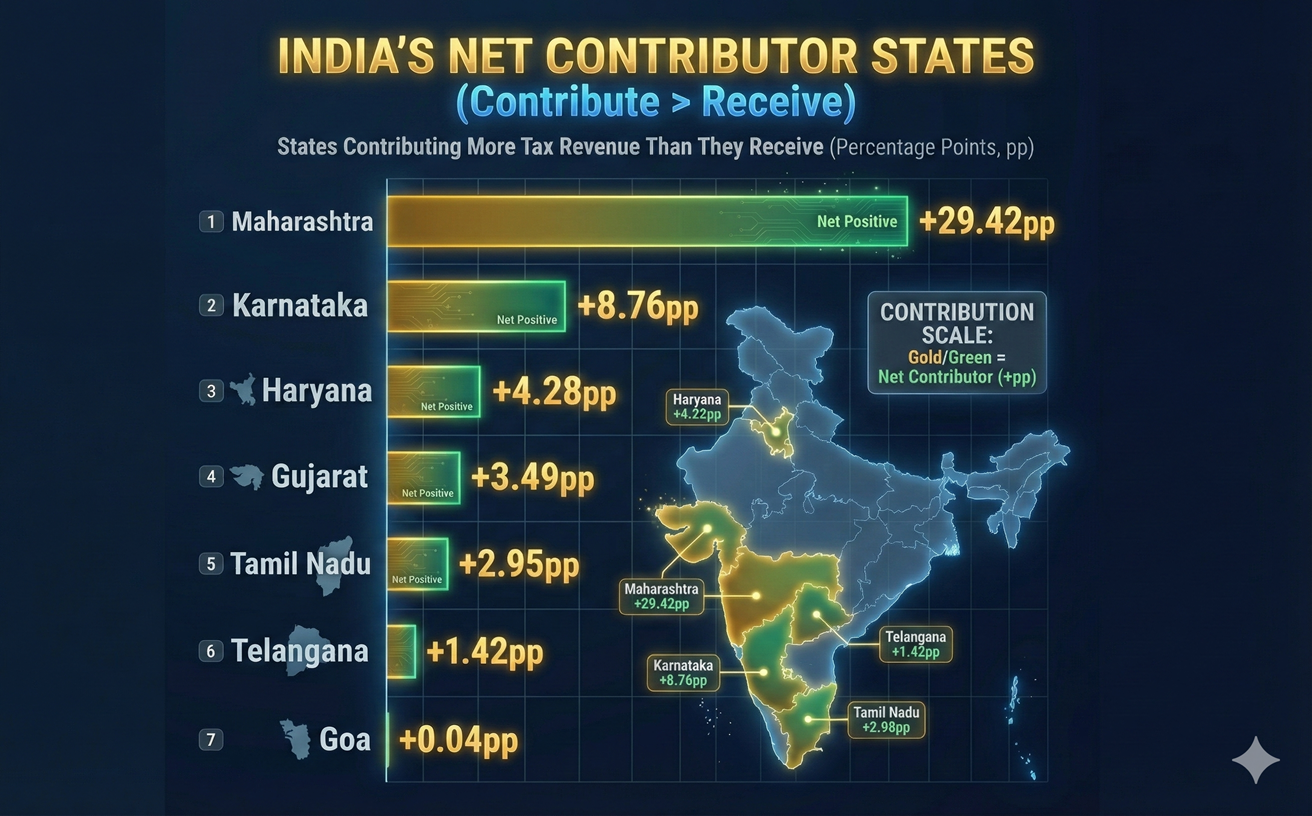
- Southern states (Karnataka, Tamil Nadu, Kerala, Andhra Pradesh) collectively contribute approximately 35% of central tax revenues but receive only about 18% of the devolved amount, raising questions about horizontal equity.
- The transition from the 14th to the 15th Finance Commission saw the vertical devolution ratio maintained at 41% of the divisible pool, but horizontal distribution weights shifted with the introduction of demographic performance and tax effort criteria.
- Year-on-year growth in devolution has been uneven, with FY 2020-21 showing a significant dip due to COVID-19's impact on central tax collections, followed by a strong recovery in subsequent years averaging 15% annual growth.
- States with higher forest cover (such as Arunachal Pradesh and Mizoram) benefit from the ecology criterion, receiving a share that compensates for opportunity costs of maintaining forest areas instead of industrial development.
Tools & Technologies
This project leverages modern web technologies to create a responsive, interactive data visualization experience directly in the browser.
Conclusion
India's tax devolution system, while designed to promote equitable growth, reveals significant tensions between efficiency and equity. The Finance Commission's formula attempts to balance competing demands: rewarding states for fiscal discipline and demographic management while compensating those with lower incomes and larger populations.
This analysis demonstrates that while the current system broadly achieves its redistributive goals, there are structural concerns about the growing gap between contributing and receiving states. As India's economy evolves, the devolution formula will need to adapt to changing demographics, urbanization patterns, and the emerging needs of a $4-trillion economy aspiring to become a $10-trillion one.
The interactive visualizations created in this project make complex fiscal data accessible to researchers, policymakers, and citizens, contributing to informed public discourse on one of India's most important governance mechanisms.