Overview & Problem Statement
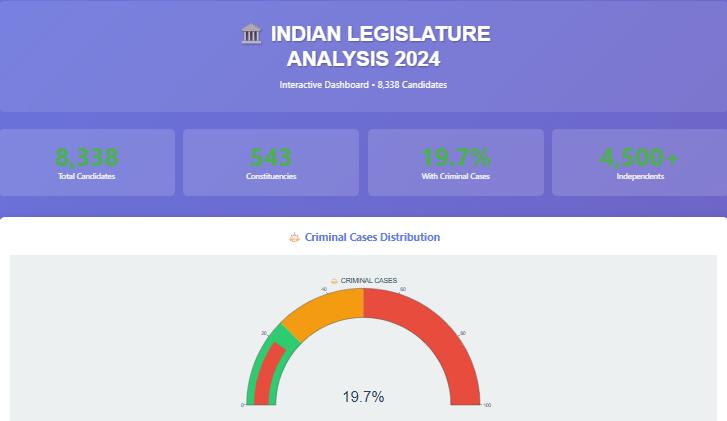
Indian general elections are the largest democratic exercise in the world. The 2024 Lok Sabha elections saw over 8,300 candidates contesting across 543 parliamentary constituencies, representing the full spectrum of Indian political diversity. Yet, public understanding of candidate profiles remains limited to headline narratives.
This project undertakes a comprehensive data analysis of every candidate who filed their nomination for the 2024 general elections. Using affidavit data submitted to the Election Commission of India, we examine criminal cases, educational backgrounds, declared assets, liabilities, and demographic profiles to surface patterns that define the character of Indian electoral politics.
The central questions driving this analysis: How prevalent are candidates with criminal backgrounds? What is the relationship between wealth and electoral success? How do national and regional parties differ in candidate selection? And where does India stand on gender representation in its legislature?
Methodology
The analysis combines structured data extraction from Election Commission filings with statistical analysis and interactive visualization to reveal patterns across thousands of candidacies.
Data Acquisition
Collected candidate affidavit data from the Election Commission of India and Association for Democratic Reforms (ADR) covering all 8,338 candidates across 543 constituencies.
Data Cleaning
Standardized party names, normalized asset declarations to common currency units, categorized criminal cases by severity (IPC sections), and resolved inconsistencies in education labels.
Exploratory Analysis
Used Python (Pandas) for grouping, aggregation, and cross-tabulation. Computed winning probability correlations with wealth, criminal records, education level, and incumbency status.
Visualization
Created interactive Plotly charts including sunburst diagrams for party hierarchies, box plots for wealth distributions, stacked bars for criminal case analysis, and geographic heat maps.
Key Findings
- Approximately 21% of all candidates (1,751 out of 8,338) declared criminal cases against them, with 15.6% facing serious charges including attempted murder, kidnapping, and crimes against women. Among winners, this proportion rises to 29%, suggesting a counterintuitive electoral advantage for candidates with criminal records.
- The median declared assets of winning candidates stood at Rs.5.74 crore, compared to Rs.18.5 lakh for losing candidates, a 31x difference. Candidates in the top wealth decile won at a rate 6x higher than those in the bottom decile, highlighting the role of money power in electoral outcomes.
- Women comprised only 9.6% of total candidates (797 out of 8,338) but won at a slightly higher success rate (8.3%) compared to male candidates (6.1%). However, major national parties fielded women in only 12-15% of their seats, predominantly in constituencies considered non-competitive.
- Educational qualification analysis reveals that 56% of candidates hold a graduate degree or higher, but significant variations exist across parties. Regional parties in southern India field proportionally more postgraduates and professionally qualified candidates compared to northern counterparts.
- Independent candidates (4,562 in total) constitute 54.7% of all candidates but win only 0.4% of seats (7 constituencies), demonstrating the near-impossibility of winning without party machinery despite the large number who attempt to contest.
- Age distribution analysis shows the average candidate age is 47 years, with fewer than 12% below 35. The BJP and INC both have median candidate ages above 50, while newer parties like AAP trend significantly younger with a median of 42 years.
Tools & Technologies
This project leverages Python's data science ecosystem for analysis and Plotly's interactive capabilities for creating publication-quality visualizations.
Conclusion
This data-driven analysis of the 2024 Lok Sabha elections paints a nuanced picture of Indian democracy. While the sheer scale of participation (8,338 candidates across 744 parties) reflects democratic vitality, the data reveals troubling patterns: the concentration of winning candidates among the wealthy, the persistent criminalization of politics, and the severe underrepresentation of women.
The analysis challenges common assumptions. Criminal cases do not deter electoral success; in fact, candidates with criminal records win at higher rates than clean candidates. Wealth is arguably the strongest predictor of electoral success, more so than education or incumbency. And despite decades of discourse around women's empowerment, gender parity in candidate selection remains distant.
These findings underscore the need for electoral reforms including stricter enforcement of campaign finance regulations, faster judicial disposition of cases against candidates, and mandatory minimum quotas for women candidates. The interactive visualizations produced in this project serve as an evidence base for these reform conversations.