Overview & Problem Statement
India's healthcare system serves 1.4 billion people across vastly different geographies, economic conditions, and cultural contexts. Despite significant progress in improving health outcomes over the past two decades, stark disparities persist between urban and rural areas, between states, and across socioeconomic groups.
This project leverages the NFHS-5 (2019-21) dataset, India's most comprehensive household-level health survey, to analyze healthcare infrastructure availability, immunization coverage, maternal health indicators, nutrition outcomes, and sanitation access at the district level. The goal is to identify the most critical gaps and generate actionable policy recommendations.
By combining SQL-based data processing with Power BI visualizations, the analysis creates an interactive dashboard that enables policymakers and researchers to explore health disparities at granular geographic levels.
Methodology
A multi-stage analytical pipeline was developed to transform raw NFHS-5 survey data into actionable insights through rigorous cleaning, analysis, and visualization.
Data Extraction
Extracted district-level indicators from NFHS-5 datasets covering maternal health, child health, nutrition, family planning, and healthcare infrastructure across all 707 districts.
SQL Processing
Used SQL queries to aggregate, join, and transform multi-table survey data. Created composite health indices by combining related indicators with weighted scoring.
Statistical Analysis
Applied Python (Pandas, NumPy, SciPy) for correlation analysis between infrastructure availability and health outcomes, clustering districts by health performance profiles.
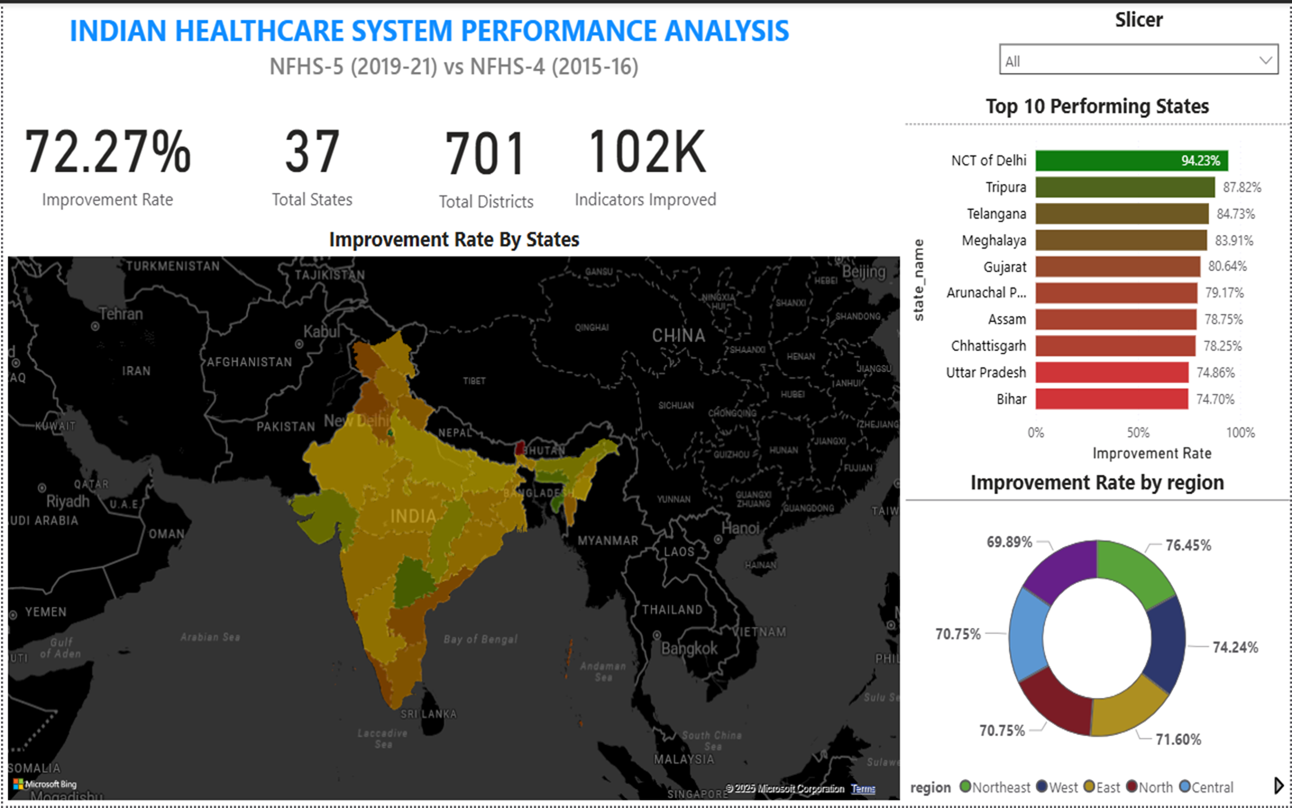
Dashboard Development
Built interactive Power BI dashboards with drill-down capabilities from national to state to district level, featuring heat maps, scatter plots, and trend comparisons.
Key Findings
- Full immunization coverage varies dramatically from 33.4% in Nagaland to 90.5% in Odisha, with a national average of 76.4%. Districts within the same state show up to 40 percentage point differences, indicating localized access barriers beyond state policy.
- Institutional delivery rates have improved nationally to 88.6%, but 47 districts (predominantly in central and northeastern India) still report rates below 60%, correlating strongly with distance to the nearest Community Health Centre and road connectivity.
- Child stunting (low height-for-age) remains above 40% in 162 districts, concentrated in a contiguous belt across Uttar Pradesh, Bihar, Jharkhand, Madhya Pradesh, and Gujarat. These districts also show the lowest dietary diversity scores.
- States that increased public healthcare expenditure to above 8% of their budget (Kerala, Tamil Nadu, Rajasthan) consistently outperform on maternal mortality, neonatal mortality, and vaccination metrics, even after controlling for per-capita income.
- Gender disparities in healthcare access persist: women in the lowest wealth quintile are 3.2x less likely to receive four or more antenatal care visits compared to the highest quintile, a gap that has narrowed only marginally since NFHS-4.
- A cluster analysis reveals five distinct district health profiles, from "high performing" (mostly urban districts in southern and western states) to "critically underserved" (remote tribal and border districts), each requiring tailored intervention strategies.
Tools & Technologies
The project combines data engineering, statistical analysis, and business intelligence tools to deliver a comprehensive healthcare analytics solution.
Conclusion
This comprehensive district-level analysis of India's healthcare system reveals that while national averages show encouraging improvement trends, they mask severe intra-state and inter-district disparities. The geographic clustering of poor health outcomes in specific corridors suggests that targeted, district-level interventions would be more effective than state-level policy alone.
The strong correlation between public health expenditure and outcomes underscores the need for increased and better-directed health spending, particularly in the 162 districts identified as critically underserved. Nutrition programs, institutional delivery incentives, and last-mile immunization campaigns should be prioritized in these areas.
The Power BI dashboard created as part of this project provides a ready-to-use tool for health administrators and researchers to identify priority districts, track progress over time, and allocate resources more effectively across India's diverse healthcare landscape.